Debugging JavaScript Code for Encompass
This section is not meant to be an exhaustive tutorial on debugging JavaScript code or using Chrome Developer Tools, but rather to show how code for Encompass is presented in the debugger, allowing the developer to test and debug their code.
Plugins
Each JavaScript file you deploy is treated as a separate plugin. In the example below, there are two plugins deployed, SimpleDebug.js and LoanFolderMoverPlugin.js.

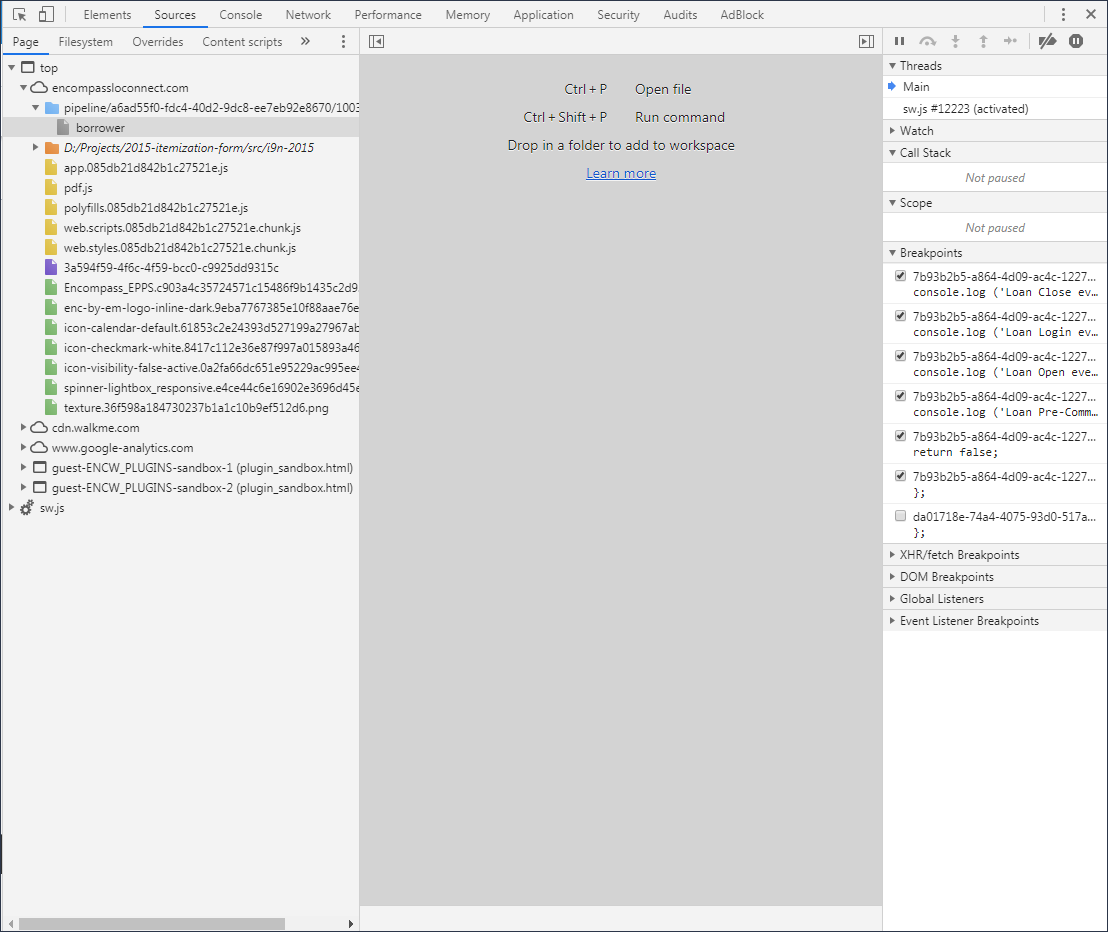
When you open a loan, in the Chrome browser you can press [F12] and the Chrome Developer Tools will open. (Yours may look different based upon your options and settings.)

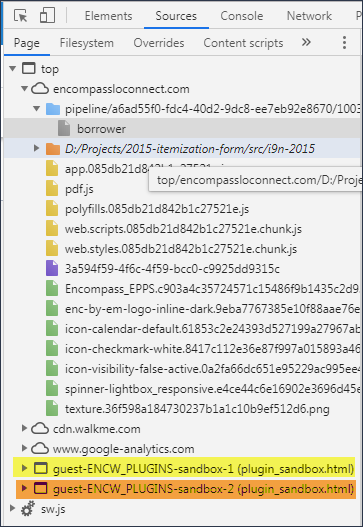
On the Page sub-tab under the Sources tab you can find all of the resources that have been loaded into the page. Because your plugins are sandboxed, you will find them in their own separate pages, under the Top page.

The two highlighted pages represent the two plugins that were deployed. Within each page you will find a source from asset-service-bucket-[server name].amazonaws.com. That is where your plugin code is. Note that the name has been changed.

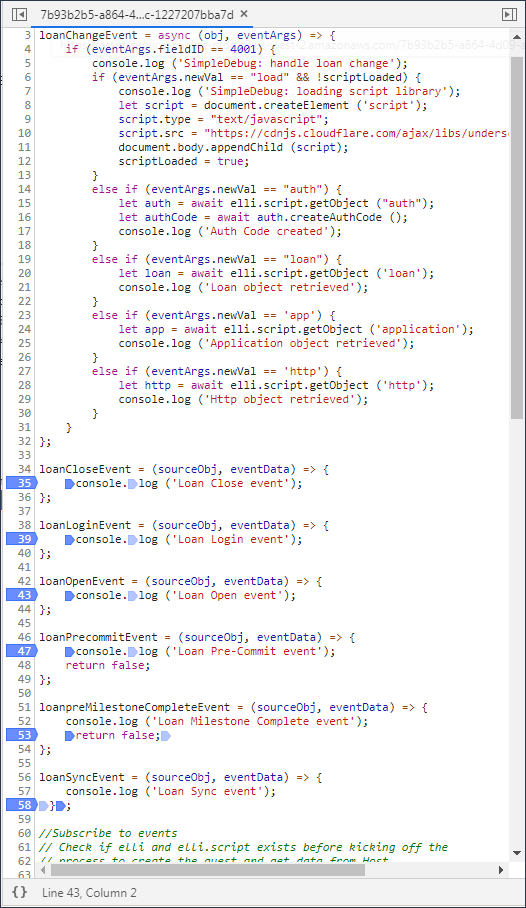
Click on that entry enables you to display your code and set breakpoints.

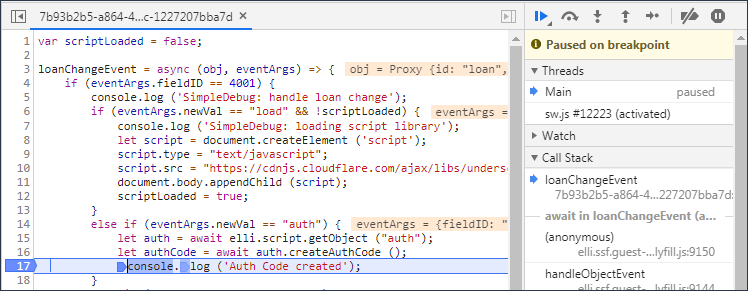
You can either hover over variables in the code, set variables in the Watch panel, or type variable names in the Console.


Note that because your code is sandboxed, after you have continued execution of your code in the debugger, the console will no longer allow you to look at variables in your plugin. You can only look at plugin values when execution is paused within your plugin.

To better understand how to use Chrome's Developer Tools, there is the excellent tutorial called Get Started with Debugging JavaScript provided in Chrome DevTools
Updated about 2 years ago
